The Coastline-on-a-Map Mistake: Why Its Length Depends on the View
Coastline length depends on map scale: learn why finer detail lengthens the line and how to choose a consistent scale for a useful comparison.
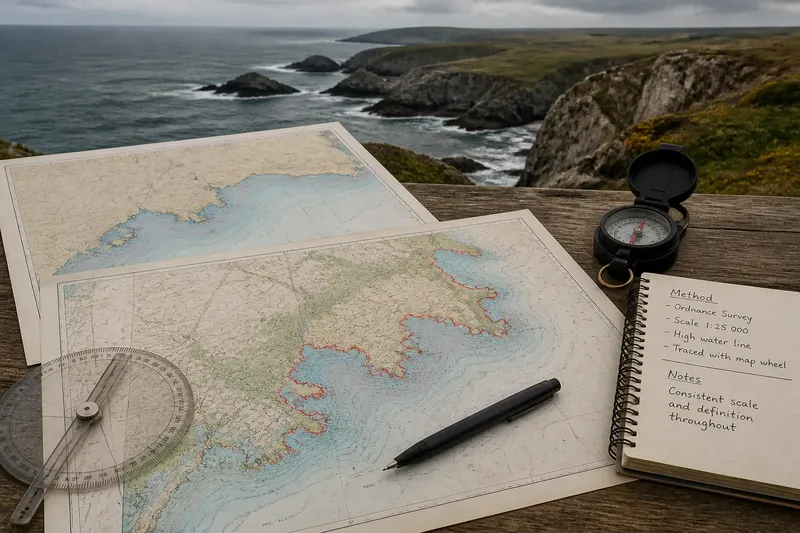
A coastline measured on a detailed chart will often come out longer than the same shore traced on a small-scale map. That difference is the coastline scale effect: as the line gains detail, it follows more bends, coves and inlets instead of smoothing past them. The larger number is not automatically a better answer. It describes a different view of the shore.
Problems arise when measurements made at different scales are treated as if they were directly comparable. A useful result depends on what the line is meant to represent, which map or data source defines it, and whether the same tracing rules are applied throughout.
When the number changes
A map line cannot preserve every indentation of a real shore. At a broad scale, a small bay may appear as a single shallow curve; at a closer scale, its headlands and smaller coves become visible. Tracing the more detailed line adds those turns to the measured distance.
Imagine you are comparing two maps of the same island. On the first, the north coast is a smooth outline. On the second, the shoreline includes narrow inlets and rocky points. If you follow each printed edge consistently, the second trace is likely to be longer because it includes more of the island’s visible irregularity, not because the shore itself has changed.
The same issue appears within a single map if one section is traced carefully and another is simplified. The result can mix a detailed estimate with a broad approximation. Before adjusting the number, check whether the whole coast was treated at a consistent level of detail.
Which line are you measuring?
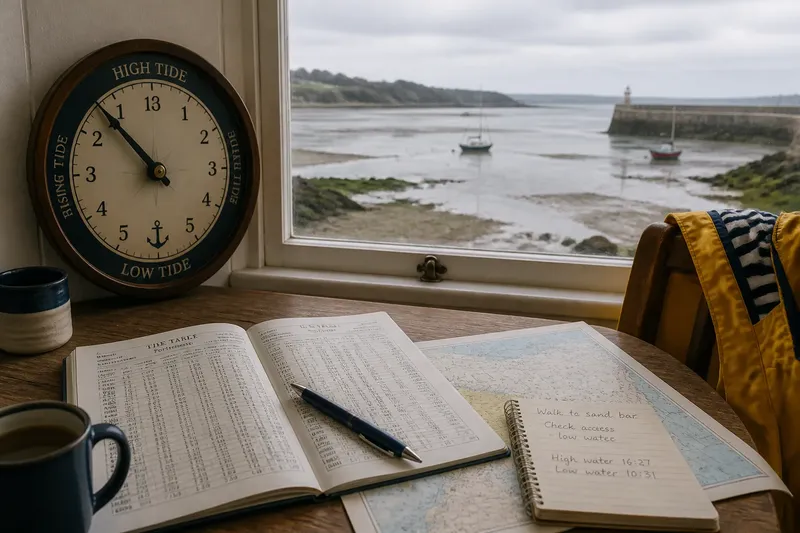
“Coastline” can mean different boundaries. A map may show a generalised shore, a high-water line, a low-water line, a cliff edge or the edge of a built structure. On a tidal shore, the waterline moves; on a marsh or estuary, the boundary between land and water may be diffuse. These are not interchangeable lines.
Start by identifying the source’s stated shoreline definition. If it is unclear, describe the line you actually used rather than assigning it a more precise name. For a comparison, use the same kind of boundary in each source and avoid blending a chart’s tidal edge with an atlas outline.
Where the relevant boundary depends on a map label, the data provider’s instructions or local rules, follow those definitions; seek qualified advice if the result has legal or safety consequences.
Why the trace looks jagged
A very detailed shoreline can contain tiny bends that are hard to reproduce reliably by hand. A cursor may cut across narrow notches, while repeated small clicks can create extra zigzags that are not really present in the source. Either habit affects the result.
Use a consistent tracing approach. Follow the visible boundary at a steady level of detail, rather than adding every pixel-level kink in one place and smoothing a broad bay elsewhere. If working on paper, a map wheel can help follow a curved line; on screen, a GIS measurement tool or mapping application may be more convenient. The tool does not decide which coastline is intended, so check the underlying map and its scale.
If the trace seems unexpectedly intricate, zoom out and inspect the whole section. Then return to the chosen scale and follow the same visible edge without inventing detail between mapped features.
Why two maps disagree
Differences can come from more than scale. Mapmakers simplify lines to keep them legible, data sources may record different shoreline features, and a map projection can affect distances across a broad area. In addition, one source may be recent while another reflects a different state of a changing shore.
For a fair comparison, keep the source, shoreline definition, scale and measurement method as consistent as possible. If you must use different maps, report that limitation plainly and treat the figures as estimates made under different conditions, not as a clean ranking.
For a local comparison, a large-scale map is often better suited to showing small features. For a broad overview, a smaller-scale map may be more practical. Neither choice supplies a scale-free “true” length.
What should you check first?
Why does a larger-scale map show a longer coast?
It can display more bends and indentations, which a tracing then follows. The added length reflects finer mapped detail rather than a change in the shore.
Can I compare coastlines from different maps?
You can compare them cautiously if you state the differences in scale, source and shoreline definition. For a more meaningful comparison, use the same source and method where possible.
Does a digital map give the exact length?
A digital tool can measure the line it has been given, but it cannot restore details missing from the data or settle which boundary counts as coastline. Its output remains tied to the source and tracing choices.
Should I include every small inlet?
Include features that are visible at the scale and consistent with your chosen definition. Do not add tiny irregularities selectively, since that makes one stretch more detailed than another.
A more useful result
When reporting a measurement, give the number alongside its method: name the map or dataset, note its scale or resolution if available, identify the shoreline boundary and explain how it was traced. This is more informative than presenting a bare length as though it were universal.
If your purpose is to compare two places, measure both from the same source and apply the same tracing rule. If your purpose is to describe one coast, choose a scale suited to the features you need to show and say what that scale leaves out.
The coastline scale effect is a reminder that a map measurement belongs to a particular view. A longer traced line may simply record more of the shore’s folds. Keep that relationship visible in the way you measure and describe the result, and the figure will be easier to interpret.